

Technical Report
To view the full version of the Technical Reports of Jiama, please click the links below:
NI 43-101 Feasibility Study for Jiama Phase II Expansion
NI 43-101 Pre-feasibility Study for Jiama Phase II Expansion
2014 EXPANSION FEASIBILITY STUDY
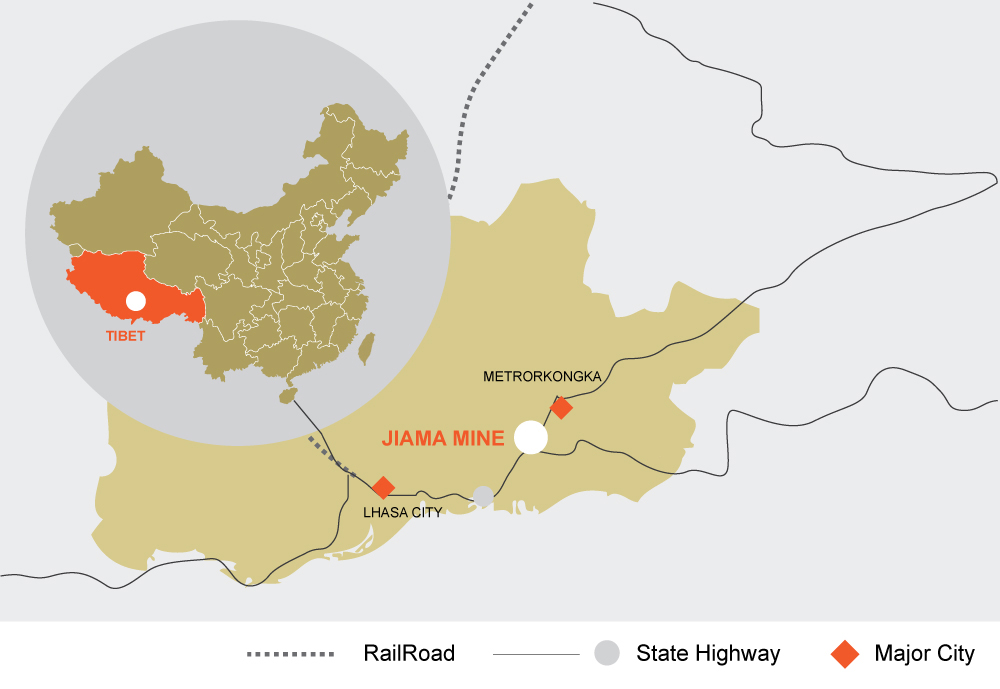
January 15, 2014 - China Gold International Resources is pleased to announce the results of an updated NI 43-101 compliant, Independent Feasibility Study for the Phase II Expansion of its Jiama Copper-Polymetallic Mine. Mining One Pty Ltd, has produced the NI 43-101 compliant report based on the Phase II Expansion Project feasibility study, prepared by the Changchun Gold Design Institute in conjunction with independent consulting engineers and the Company’s management.
Phase I of the Jiama Project commenced commercial production in September 2010 and included the development of the Tongqianshan and Niumatang open pits. These pits currently produce 1.8 million tonnes per annum (“Mtpa”) of run-of-mine (“ROM”) ore. The ore from these mines is processed via two processing plants with a combined processing capacity of 6,000 tonnes of ore per day (“tpd”). The Company plans to expand the Project production capacity to 50,000 tpd (Phase II plant capacity) with the addition of a new floatation plant (44,000 tpd ore), the development of two additional open-pits (Jiaoyan and South Pits) and the expansion of the underground mining operation. Total production is planned to increase from its current production rate of 1.8 Mtpa to 16.5 Mtpa of ROM ore. Metal concentrate (saleable product), will be sold to smelters within China.
Highlights
(All amounts are presented in US dollars unless otherwise stated)
- Copper (Cu) Measured and Indicated Mineral Resources increased to 1,486 million tonnes at 0.41% Cu from 1,053 million tonnes at 0.44% Cu;
- Copper Proved and Probable Mineral Reserves increased to 441 million tonnes at a grade of 0.61% Cu from 363 million tonnes at 0.77% Cu;
- Contained copper in the resources increased to 6.138 million tonnes from 4.64 million tonnes;
- Total production rate is expected to grow to 16.5 Mtpa of ROM ore: 9.9 Mtpa from open-pit and 6.6 Mtpa from underground operations:
- Phase II plant capacity will come online in two stages in 2015 and 2016
- Ramp up to an annual processing capacity approximating 16.5 Mtpa of ROM ore is expected to happen during 2017 and is expected to continue until 2039 when the reserves from the open pit mines are exhausted
- After 2039, operations will continue from the underground mine until 2049 at an average annual rate of 5.4 Mtpa of ROM ore
- At the completion of operations the total recovered metal is estimated to be:
- 5.3 billion pounds of copper (“Cu”)
- 192.4 million pounds of molybdenum (“Mo”)
- 101.3 million ounces of silver (“Ag”)
- 1.5 million ounces of gold (“Au”)
- 828.2 million pounds of lead (“Pb”)
- 314.0 million pounds of zinc (“Zn”)
- Average annual metal production is estimated to be:
- 67 thousand tonnes of copper
- 2.4 thousand tonnes of molybdenum
- 2.8 million ounces of silver
- 42 thousand ounces of gold
- 10.4 thousand tonnes of lead
- 4.0 thousand tonnes of zinc
- Contributions by metal to total sales is: 66.5% copper, 12.7% molybdenum, 8.6% silver, 8.3% gold, 3.5% lead and 1.3% zinc.
- Estimated life of mine is 35 years;
- Estimated capital expenditure is $716.2 million ($1.59 per tonne of ore);
- Estimated total operating costs are $23.48 per tonne of ore, of which:
- Mining costs are $11.50 per tonne of ore
- Processing costs are $10.06 per tonne of ore
- Fixed costs are $0.33 per tonne of ore
- Overhead costs are $1.58 per tonne of ore
- A Net Present Value (NPV) of over $1.3 billion with nominal cash flow of $5.8 billion after-tax at a discount rate of 9% based on metal prices of:
- $2.90/lb copper
- $15.5/lb molybdenum
- $0.98/lb lead
- $0.95/lb zinc
- $1,300/oz gold
- $20/oz silver
- After-tax Internal Rates of Return (IRR) of 24.0% with a payback period of 6.72 years
Capex and Cash Flow Analysis
Estimated capital expenditures for the Phase II Expansion of the Project will be approximately $716 million, including $350 million for processing and $366 million for mining.
The long term metal prices used for the Feasibility Study are contained in Table 1 along with sensitivity data. Prices for zinc and lead are $0.98/lb and $0.95/lb respectively.
The after-tax net present value ("NPV") is over $1.3 billion with a discount rate of 9%, giving a payback period of 6.7 years and IRR of 24%. The undiscounted, cumulative net cash flow is approximately $5.8 billion.
Table 1: Jiama Copper-Polymetallic Project – NPV and IRR Summary
| Long Term Metal Price |
|
NPV ($ Million) |
IRR |
||||||
| Cu ($/lb) |
Mo ($/lb) |
Au ($/oz) |
Ag ($/oz) |
0% Disc. rate |
7% Disc, rate |
9% Base Disc. rate |
11% Disc. rate |
||
| $2.90 | $15.5 | $1,300 | $20 |
Pre-Tax |
$7,406 | $2,461 | $1,873 | $1,438 | 30% |
|
After-Tax |
$5,785 | $1,795 | $1,324 | $978 | 24% | ||||
Mineral Resources Estimate
A Mineral Resource estimate, dated November 20, 2013, has been independently completed by Mining One Pty Ltd in accordance with the CIM Definitions Standards under NI 43-101. The Resource estimate is based on information collected up to November 12, 2012. Assaying and geological logging and testing of the core subsequent to November 2012 including an extensive drill program conducted in 2013 will be included in future updates of the Mineral Resources and Reserves.
During the review of the data Mining One Pty Ltd noted that whilst the mineralization occurs within a single mineralized body, gold and silver mineralization within the ore body had a significantly higher spatial variability than the other elements. As a result Mining One Pty Ltd has classified the Au and Ag resource presented in Table 3 separately; this classification takes into account the proposed large scale mining techniques where Au and Ag will only be credits to the overall products from the operations. Mining One Pty Ltd has assumed that Au and Ag will not be assigned a single cut-off grade for a selected mining block and will be mined in conjunction with the other elements.
The Mineral Resources are summarized in Tables 2 and 3. The Mineral Resources presented in Table 3 for Au and Ag are inclusive and not in addition to the Mineral Resources in Table 2 and occur within the same mineralized body.
Table 2: Jiama Project - Cu, Mo, Pb and Zn Mineral Resources
Reported at a 0.3% Cu Equivalent Cut Off Grade*, as of 20th of November, 2013
| Rock Type | Class | Quantity Mt |
Cu % |
Mo % |
Pb % |
Zn % |
Cu Metal (kt) |
Mo Metal (kt) |
Pb Metal (kt) |
Zn Metal (kt) |
|---|---|---|---|---|---|---|---|---|---|---|
| Skarn | Measured | 42.8 | 0.66 | 0.041 | 0.06 | 0.04 | 281 | 17 | 28 | 19 |
| Indicated | 453.0 | 0.69 | 0.040 | 0.15 | 0.09 | 3,114 | 183 | 676 | 399 | |
| M+I | 495.8 | 0.68 | 0.040 | 0.14 | 0.08 | 3,395 | 200 | 704 | 417 | |
| Inferred | 125.5 | 0.46 | 0.038 | 0.20 | 0.10 | 577 | 47 | 248 | 125 | |
|
|
||||||||||
| Hornfels | Measured | 54.9 | 0.23 | 0.031 | 0.03 | 0.01 | 127 | 17 | 15 | 5 |
| Indicated | 852.9 | 0.28 | 0.030 | 0.01 | 0.01 | 2,368 | 253 | 69 | 64 | |
| M+I | 907.8 | 0.27 | 0.030 | 0.01 | 0.01 | 2,496 | 270 | 84 | 69 | |
| Inferred | 276.6 | 0.24 | 0.026 | 0.02 | 0.02 | 660 | 73 | 63 | 49 | |
|
|
||||||||||
| Porphyry | Measured | 2.6 | 0.26 | 0.049 | 0.02 | 0.01 | 7 | 1 | 1 | 0 |
| Indicated | 79.9 | 0.30 | 0.039 | 0.01 | 0.01 | 240 | 31 | 6 | 8 | |
| M+I | 82.4 | 0.30 | 0.040 | 0.01 | 0.01 | 247 | 33 | 6 | 8 | |
| Inferred | 4.0 | 0.24 | 0.085 | 0.01 | 0.02 | 10 | 3 | 0 | 1 | |
|
|
||||||||||
| Total | Measured | 100.2 | 0.41 | 0.035 | 0.04 | 0.02 | 415 | 36 | 43 | 24 |
| Indicated | 1,385.8 | 0.41 | 0.034 | 0.05 | 0.03 | 5,772 | 468 | 751 | 470 | |
| M+I | 1,486.0 | 0.41 | 0.034 | 0.05 | 0.03 | 6,138 | 503 | 794 | 495 | |
| Inferred | 406.0 | 0.31 | 0.030 | 0.08 | 0.04 | 1,247 | 124 | 312 | 174 | |
|
|
||||||||||
Table 3: Jiama Project – Au and Ag Mineral Resources
Reported at a 0.3% Cu Equivalent Cut Off Grade* as of 20th of November, 2013
| Rock Type | Class | Quantity (Mt) Mtonnes |
Au g/t |
Ag g/t |
Au Moz |
Ag Moz |
|---|---|---|---|---|---|---|
|
|
||||||
| Skarn | Measured | 42.8 | 0.22 | 13.39 | 0.304 | 18.429 |
| Indicated | 453.0 | 0.27 | 15.59 | 3.901 | 227.094 | |
| M+I | 495.8 | 0.26 | 15.40 | 4.205 | 245.523 | |
| Inferred | 125.5 | 0.19 | 11.90 | 0.750 | 47.995 | |
|
|
||||||
| Hornfels | Measured | 54.9 | 0.02 | 1.32 | 0.041 | 2.330 |
| Indicated | 852.9 | 0.03 | 1.38 | 0.909 | 37.733 | |
| M+I | 907.8 | 0.03 | 1.37 | 0.950 | 40.063 | |
| Inferred | 276.6 | 0.06 | 2.10 | 0.562 | 18.644 | |
|
|
||||||
| Porphyry | Measured | 2.6 | 0.06 | 3.42 | 0.005 | 0.281 |
| Indicated | 79.9 | 0.07 | 2.93 | 0.174 | 7.522 | |
| M+I | 82.4 | 0.07 | 2.94 | 0.179 | 7.803 | |
| Inferred | 4.0 | 0.04 | 2.25 | 0.006 | 0.287 | |
|
|
||||||
| Total | Measured | 100.2 | 0.11 | 6.53 | 0.349 | 21.040 |
| Indicated | 1,385.8 | 0.11 | 6.11 | 4.985 | 272.349 | |
| M+I | 1,486.0 | 0.11 | 6.14 | 5.334 | 293.389 | |
| Inferred | 406.0 | 0.10 | 5.13 | 1.317 | 66.926 | |
|
|
||||||
Note: Figures reported are rounded which may result in small tabulation errors.
The Copper Equivalent basis for the reporting of resources has been compiled on the following basis:
CuEq Resources:
= (Ag Grade * Ag Price + Au Grade * Au Price + Cu Grade * Cu Price + Pb Grade * Pb Price + Zn Grade * Zn Price + Mo Grade * Mo Price) / Copper Price
Mineral Reserves Estimate
A Mineral Reserve estimate, dated 20th of November, 2013, has been independently verified by Mining One Pty Ltd in accordance with the CIM Definitions Standards under NI 43-101.
The selected mining strategies developed by CGDI (Changchun Gold Design Institute) consider conventional truck shovel mining for the Jiaoyan and South open pits. Various mining methods have been examined for the Phase II Expansion Underground Mine with the primary method being Sub Level Stoping with fill (Primary/Secondary/Tertiary).
The reserve estimate for the Jiama underground mine is based on a combination of Sub Level Open Stoping with Paste fill, Room and Pillar and Cut and Fill. Table 4 presents the Mineral Reserves estimate for the Project (Open pit and underground mines).
Table 4: Jiama Project Statement of NI 43-101 Mineral Reserve Estimate as of 20th of Nov., 2012
|
Metal
|
|||||||||||||
|
|
|||||||||||||
|
Type
|
Quantity Mt
|
Cu %
|
Mo %
|
Pb %
|
Zn %
|
Au g/t
|
Ag g/t
|
Cu kt
|
Mo kt
|
Pb kt
|
Zn kt
|
Au Moz
|
Ag Moz
|
|
|
|||||||||||||
|
Proven
|
24.96
|
0.64
|
0.04
|
0.05
|
0.03
|
0.19
|
11.35
|
160
|
10
|
12
|
8
|
0.2
|
9.1
|
|
Probable
|
415.87
|
0.61
|
0.03
|
0.13
|
0.08
|
0.19
|
11.52
|
2,548
|
133
|
551
|
319
|
2.5
|
154.1
|
|
|
|||||||||||||
|
Subtotal
|
440.83
|
0.61
|
0.03
|
0.13
|
0.07
|
0.19
|
11.51
|
2,708
|
143
|
563
|
327
|
2.7
|
163.2
|
Notes:
1. The Mineral Reserve as of 20th November 2013.
2. All Mineral Reserves have been estimated in accordance with the JORC code and have been reconciled to CIM standards as prescribed by the National Instrument 43-101.
3. Mineral Reserves were estimated using the following mining and economic factors:
Open Pits:
- 5% dilution factor and 95% recovery were applied to the mining method;
- overall slope angles of 43 degrees;
- a copper price of USD$ 2.9/lbs;
- an overall processing recovery of 88 - 90% for copper
Underground:
- 10% dilution added to all Sub-Level Open Stoping;
- Stope recovery is 87% for Sub-Level Open Stoping;
- An overall processing recovery of 88 – 90% for copper.
4. The cut-off grade for Mineral Reserves has been estimated at copper equivalent grades of 0.3%Cu (NSR) for the open pits and 0.45%Cu (NSR) for the underground mine.
5. Mineral Reserve Estimates were prepared under the guidance of Anthony R. Cameron who is a sub-consultant to Mining One Pty Ltd. He is a Fellow of the Australasian Institute of Mining and Metallurgy and has over 26 years of relevant engineering experience and is the Qualified Person for Mineral Reserves.

